benchmarks
Benchmarks
Module |
Description
Fields
filename_prefixthe prefix for the produced files.show_seedshows the seed numbers in the ROC type plots and for the outliers in the box-plots.errorbarshows vertical estimated 5% and 95% quantiles in the ROC type plots.errorbarhshows horisontal estimated 5% and 95% quantiles in the ROC type plots.scattershows scatter plots in the ROC type plots.pathjoins the median values of each parameter setting for a specific with a line. So for this to become a path, you need to specify range of values for some of the fields in the corresponding algorithm module object.textshows the parameter value in the ROC type plots. If this is set to false, a dot will be plotted instead.
Output
elapsed_time_joint/Box-plots for the total times over all seeds.f1_skel_joint/F1 score box-plots.FNR_FPR_skel/Median false negative rate (FNR) / false positive rate (FP/P) for the skeleton graph (undirected version).FPR_TPR_skel/Median FP/P vs. TP/P for the skeleton graph (undirected version).FPR_TPR_pattern/Median FP/P vs. TP/P for the pattern graph (same as skeleton for undirected graphs).FPRp_FNR_skel/Median FP/P vs. FNR for the skeleton graph.graph_type/Plots the type of graph for each graph estimate.joint_benchmarks.csvBenchmarks joined in a CSV file (this may be analyzed using any preferred software).ROC_data.csvSummarized benchmarks joined in a CSV file.SHD_cpdag_joint/Structural Hamming distance (SHD) box-plots.

Fig. 54 FPR_TPR_skel.png
The following plots are also produced
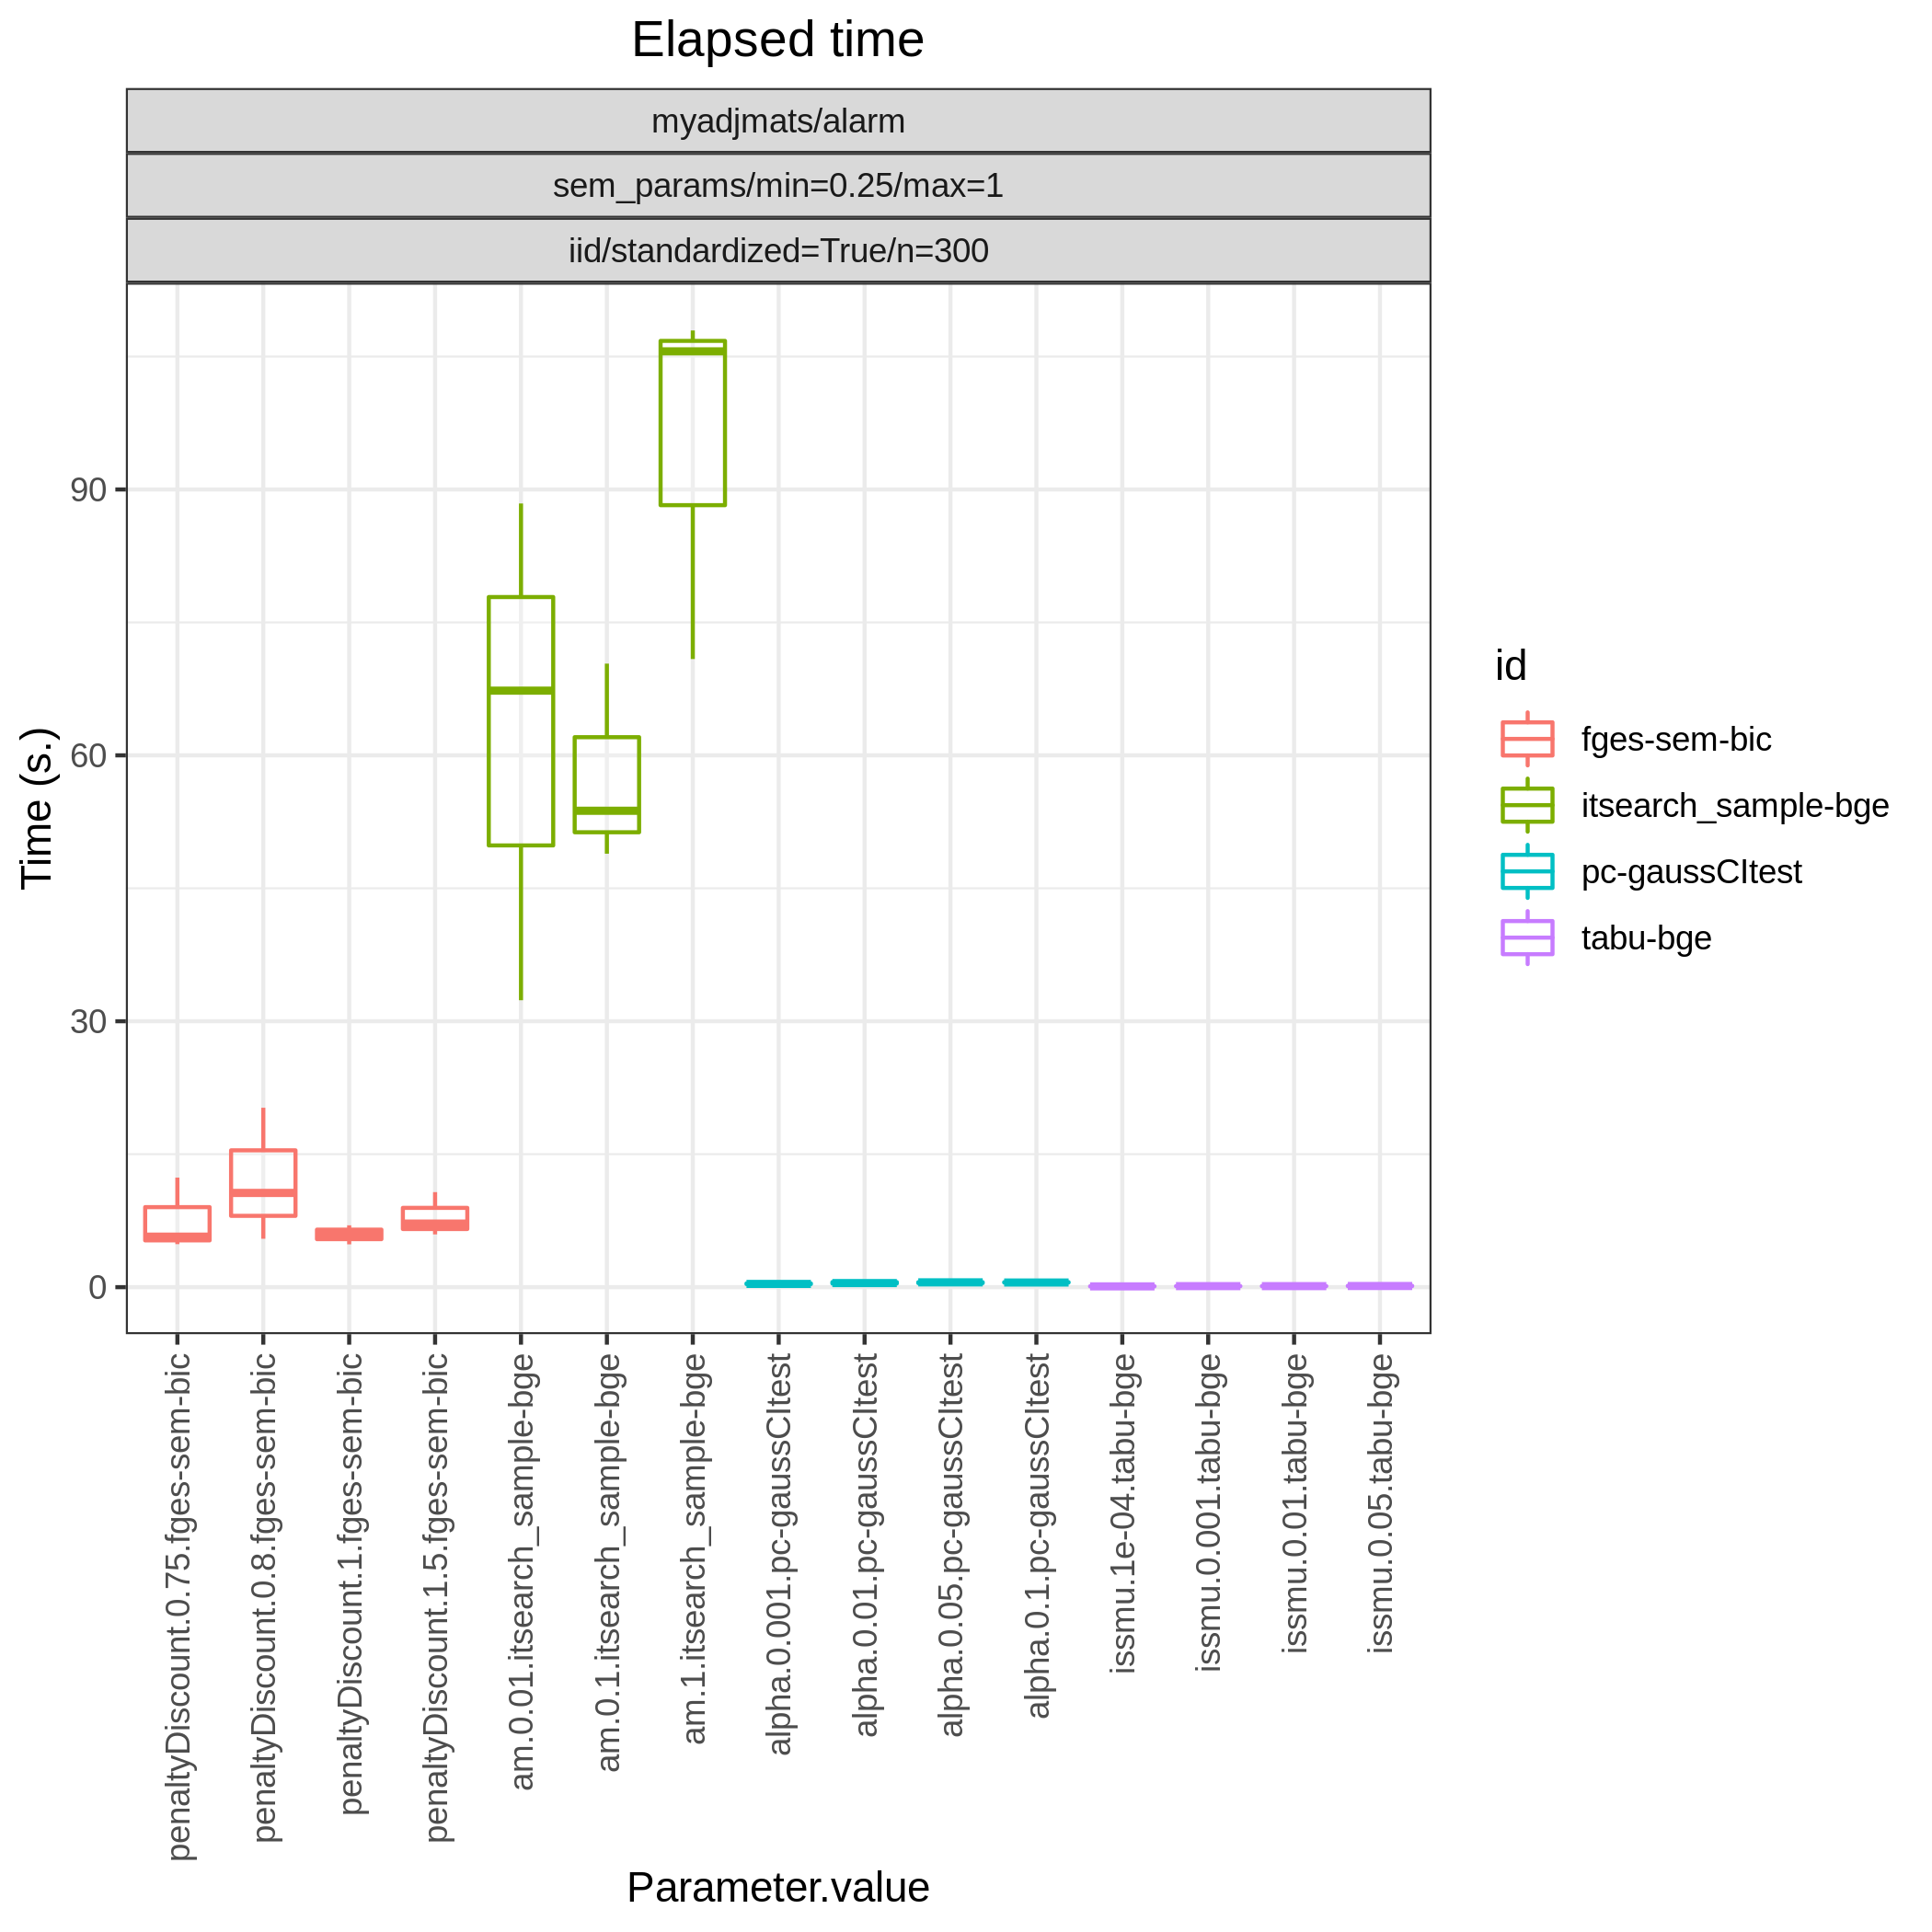
Fig. 55 elapsed_time_joint.png
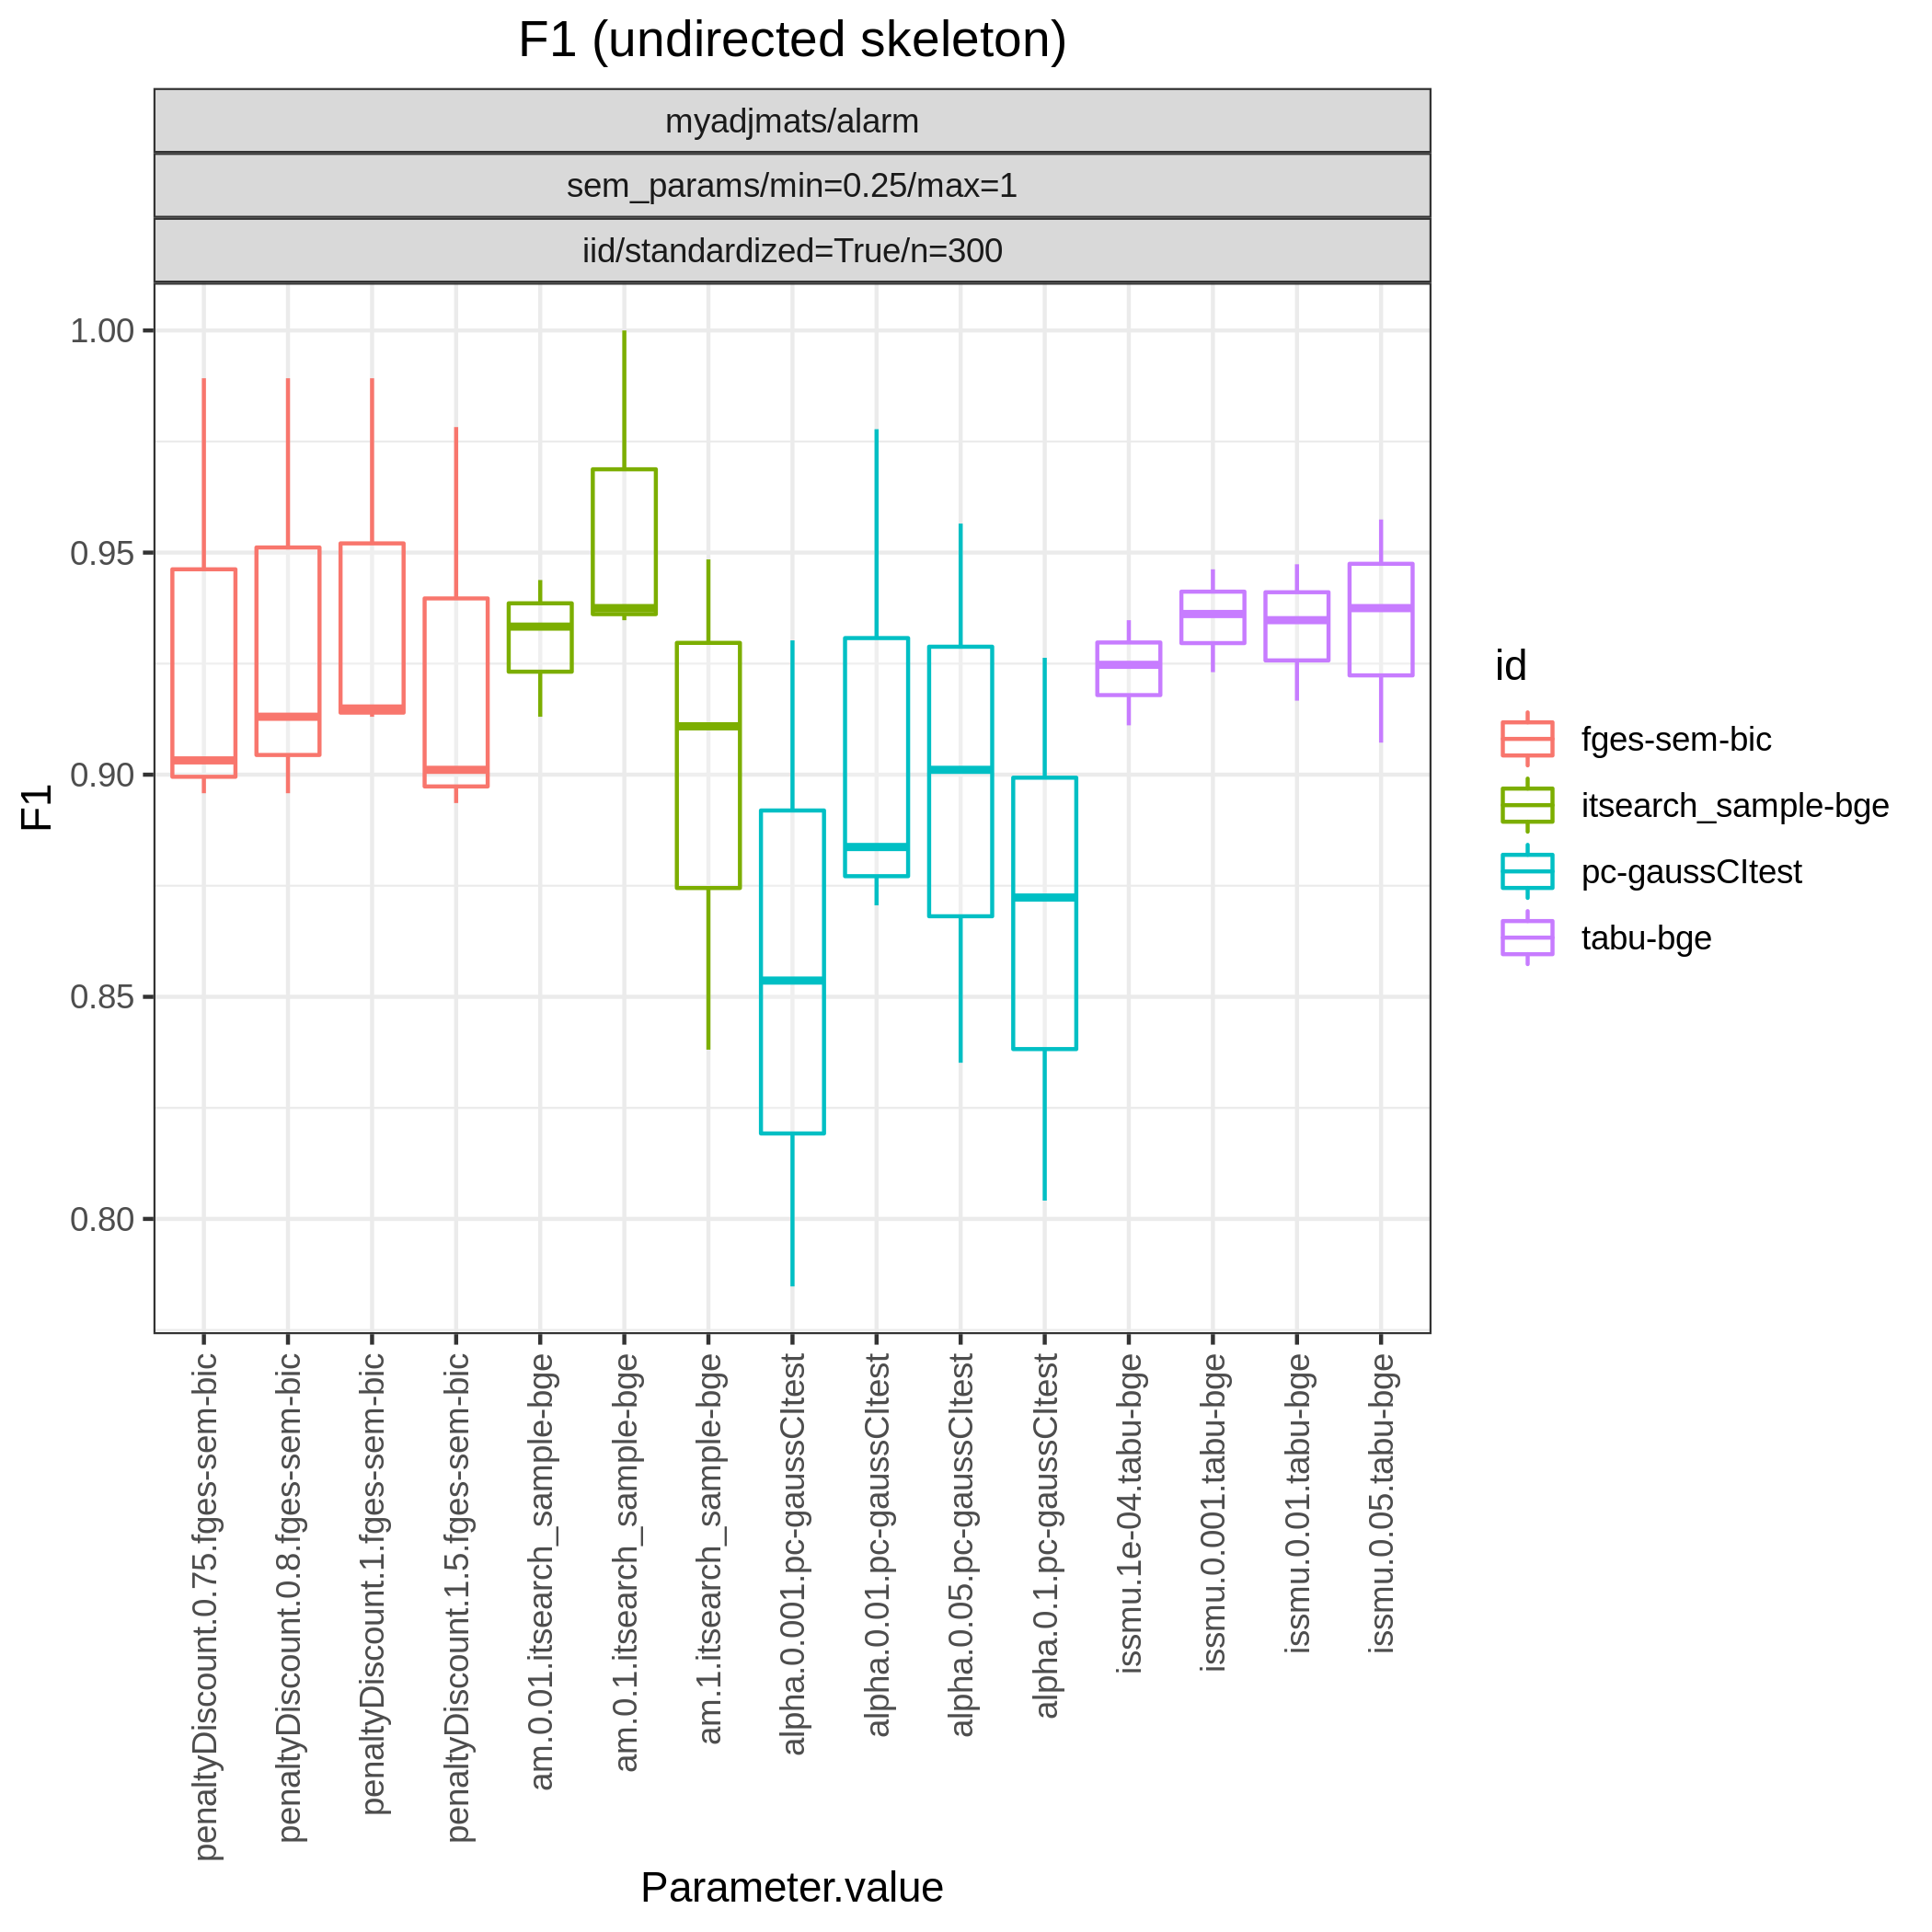
Fig. 56 f1_skel_joint.png
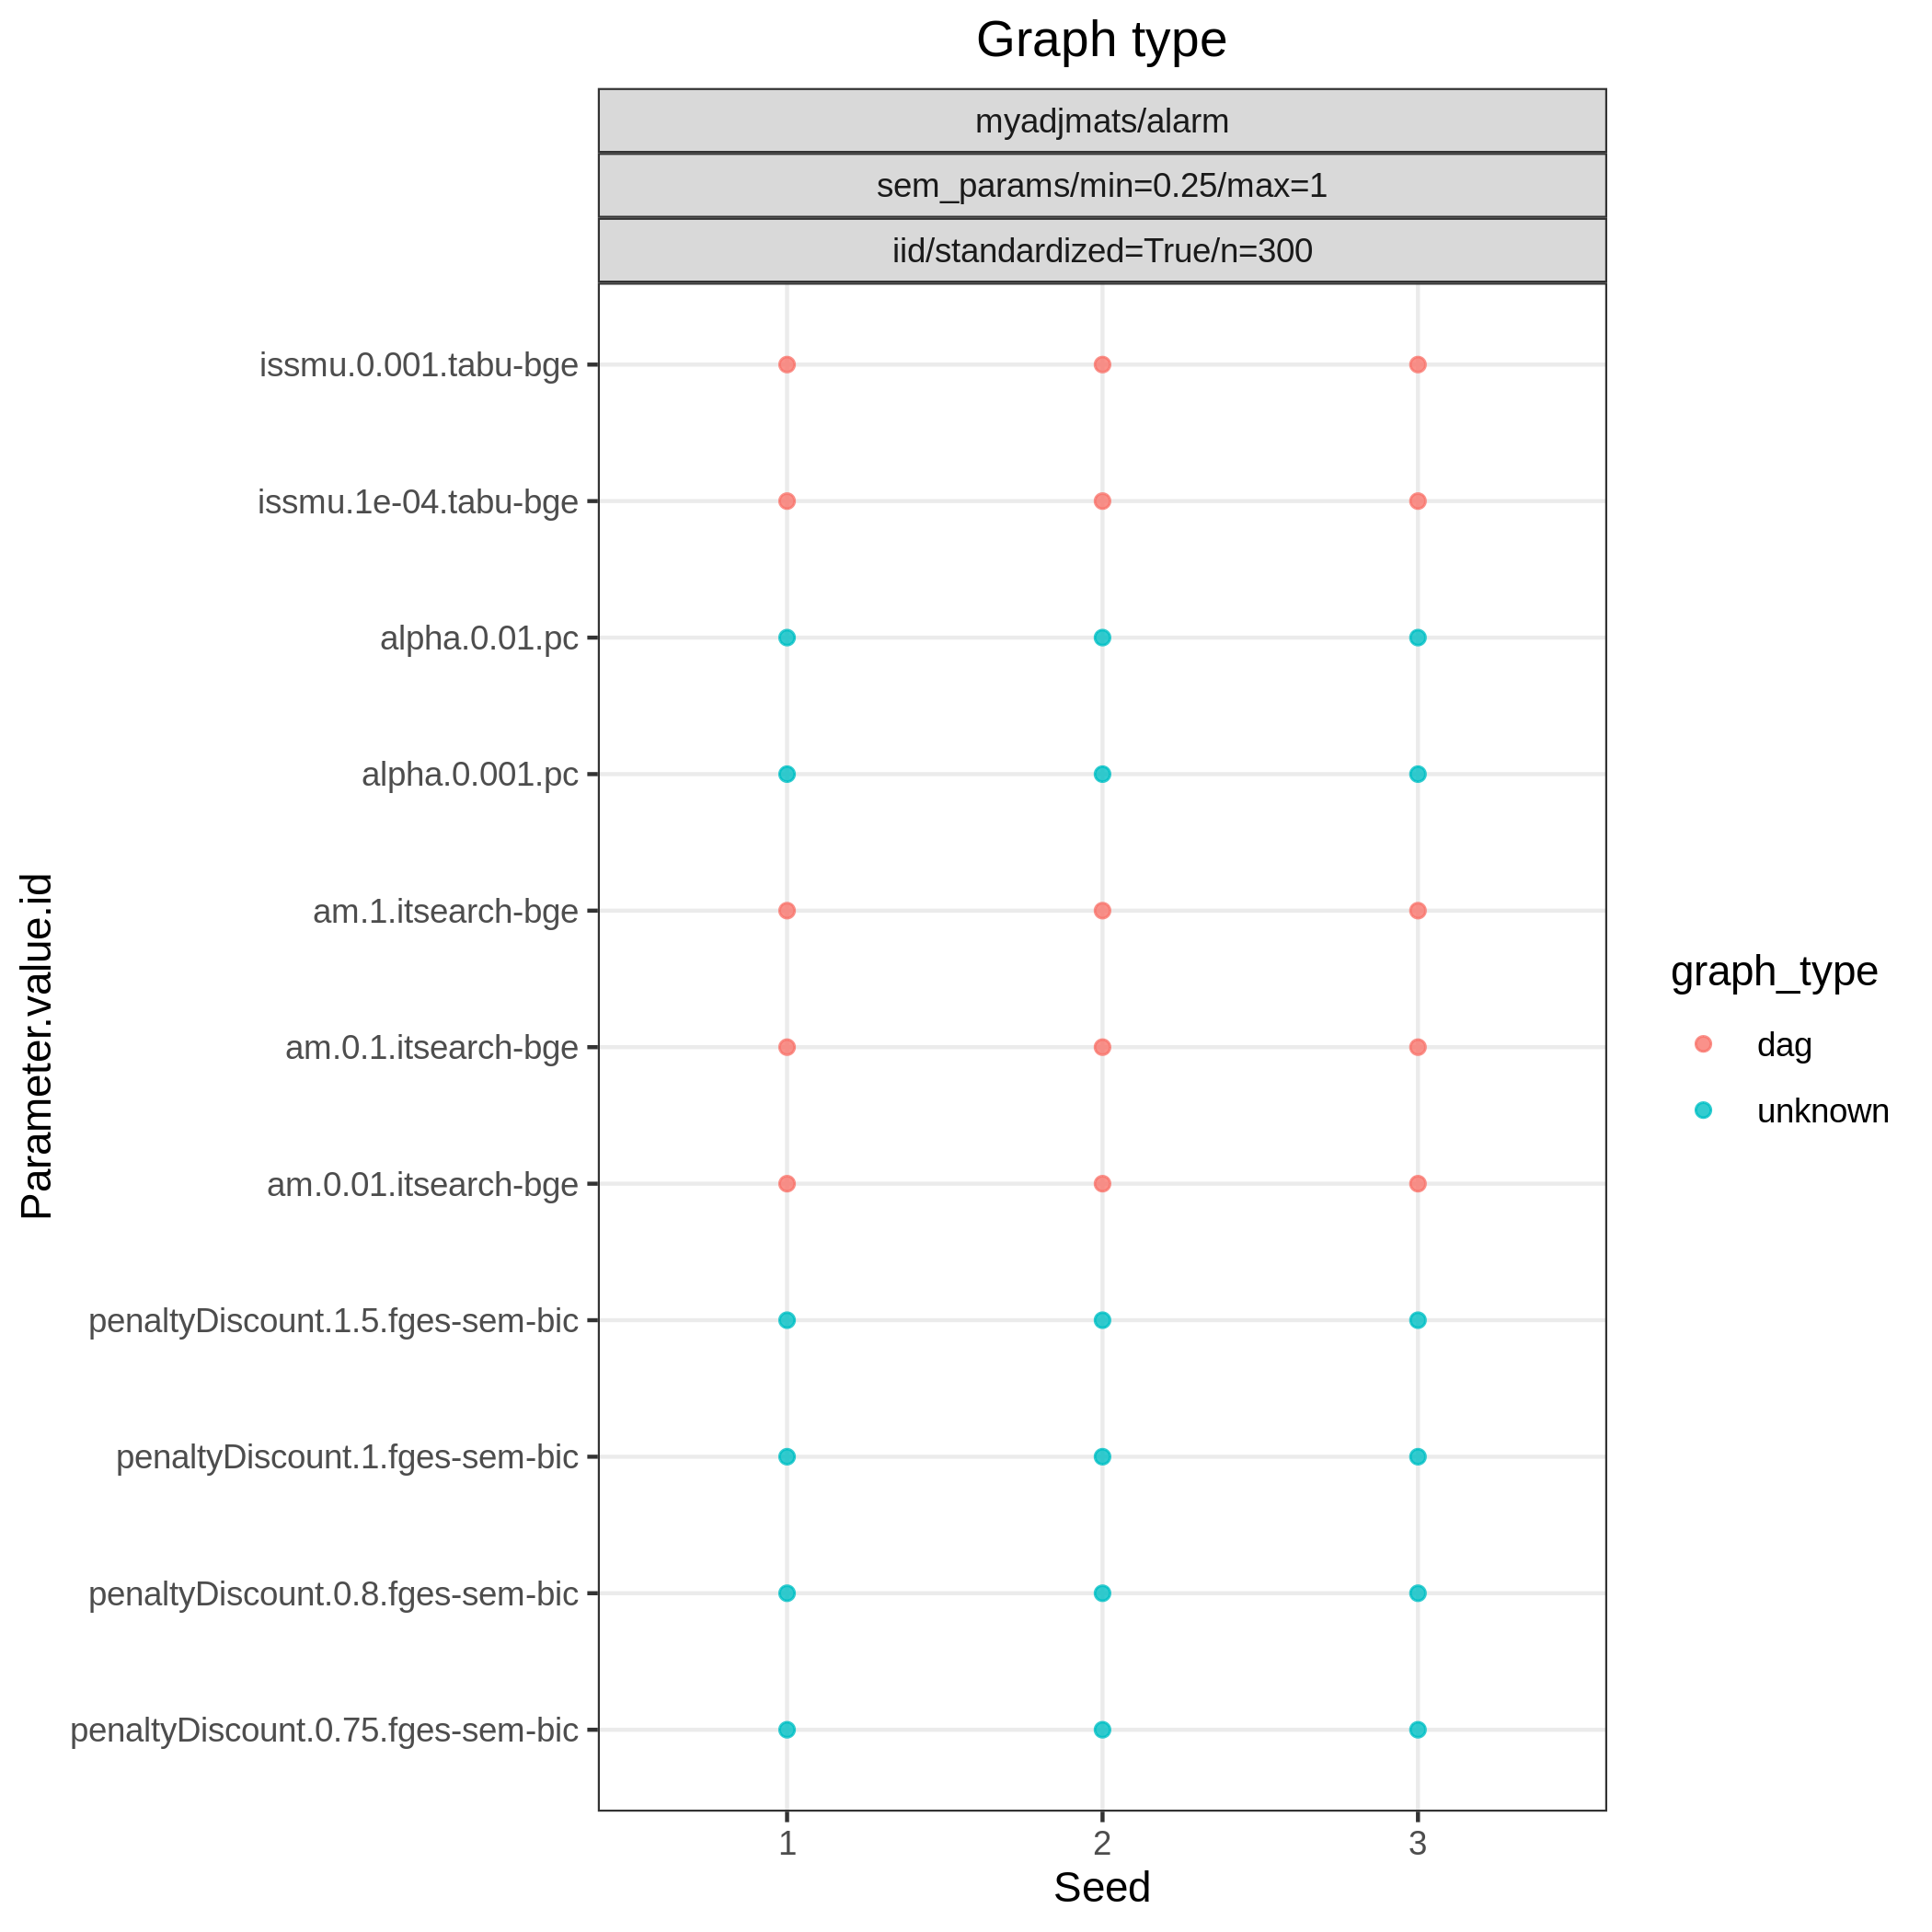
Fig. 57 graph_type.png
Example
[
  {
    "filename_prefix": "example/",
    "show_seed": true,
    "errorbar": true,
    "errorbarh": false,
    "scatter": true,
    "xlim": [
      0,
      0.3
    ],
    "ylim": [
      0,
      1
    ],
    "path": true,
    "text": false,
    "ids": [
      "fges-sem-bic",
      "pc-gaussCItest",
      "mmhc-bge-zf",
      "omcmc_itsample-bge"
    ]
  }
]